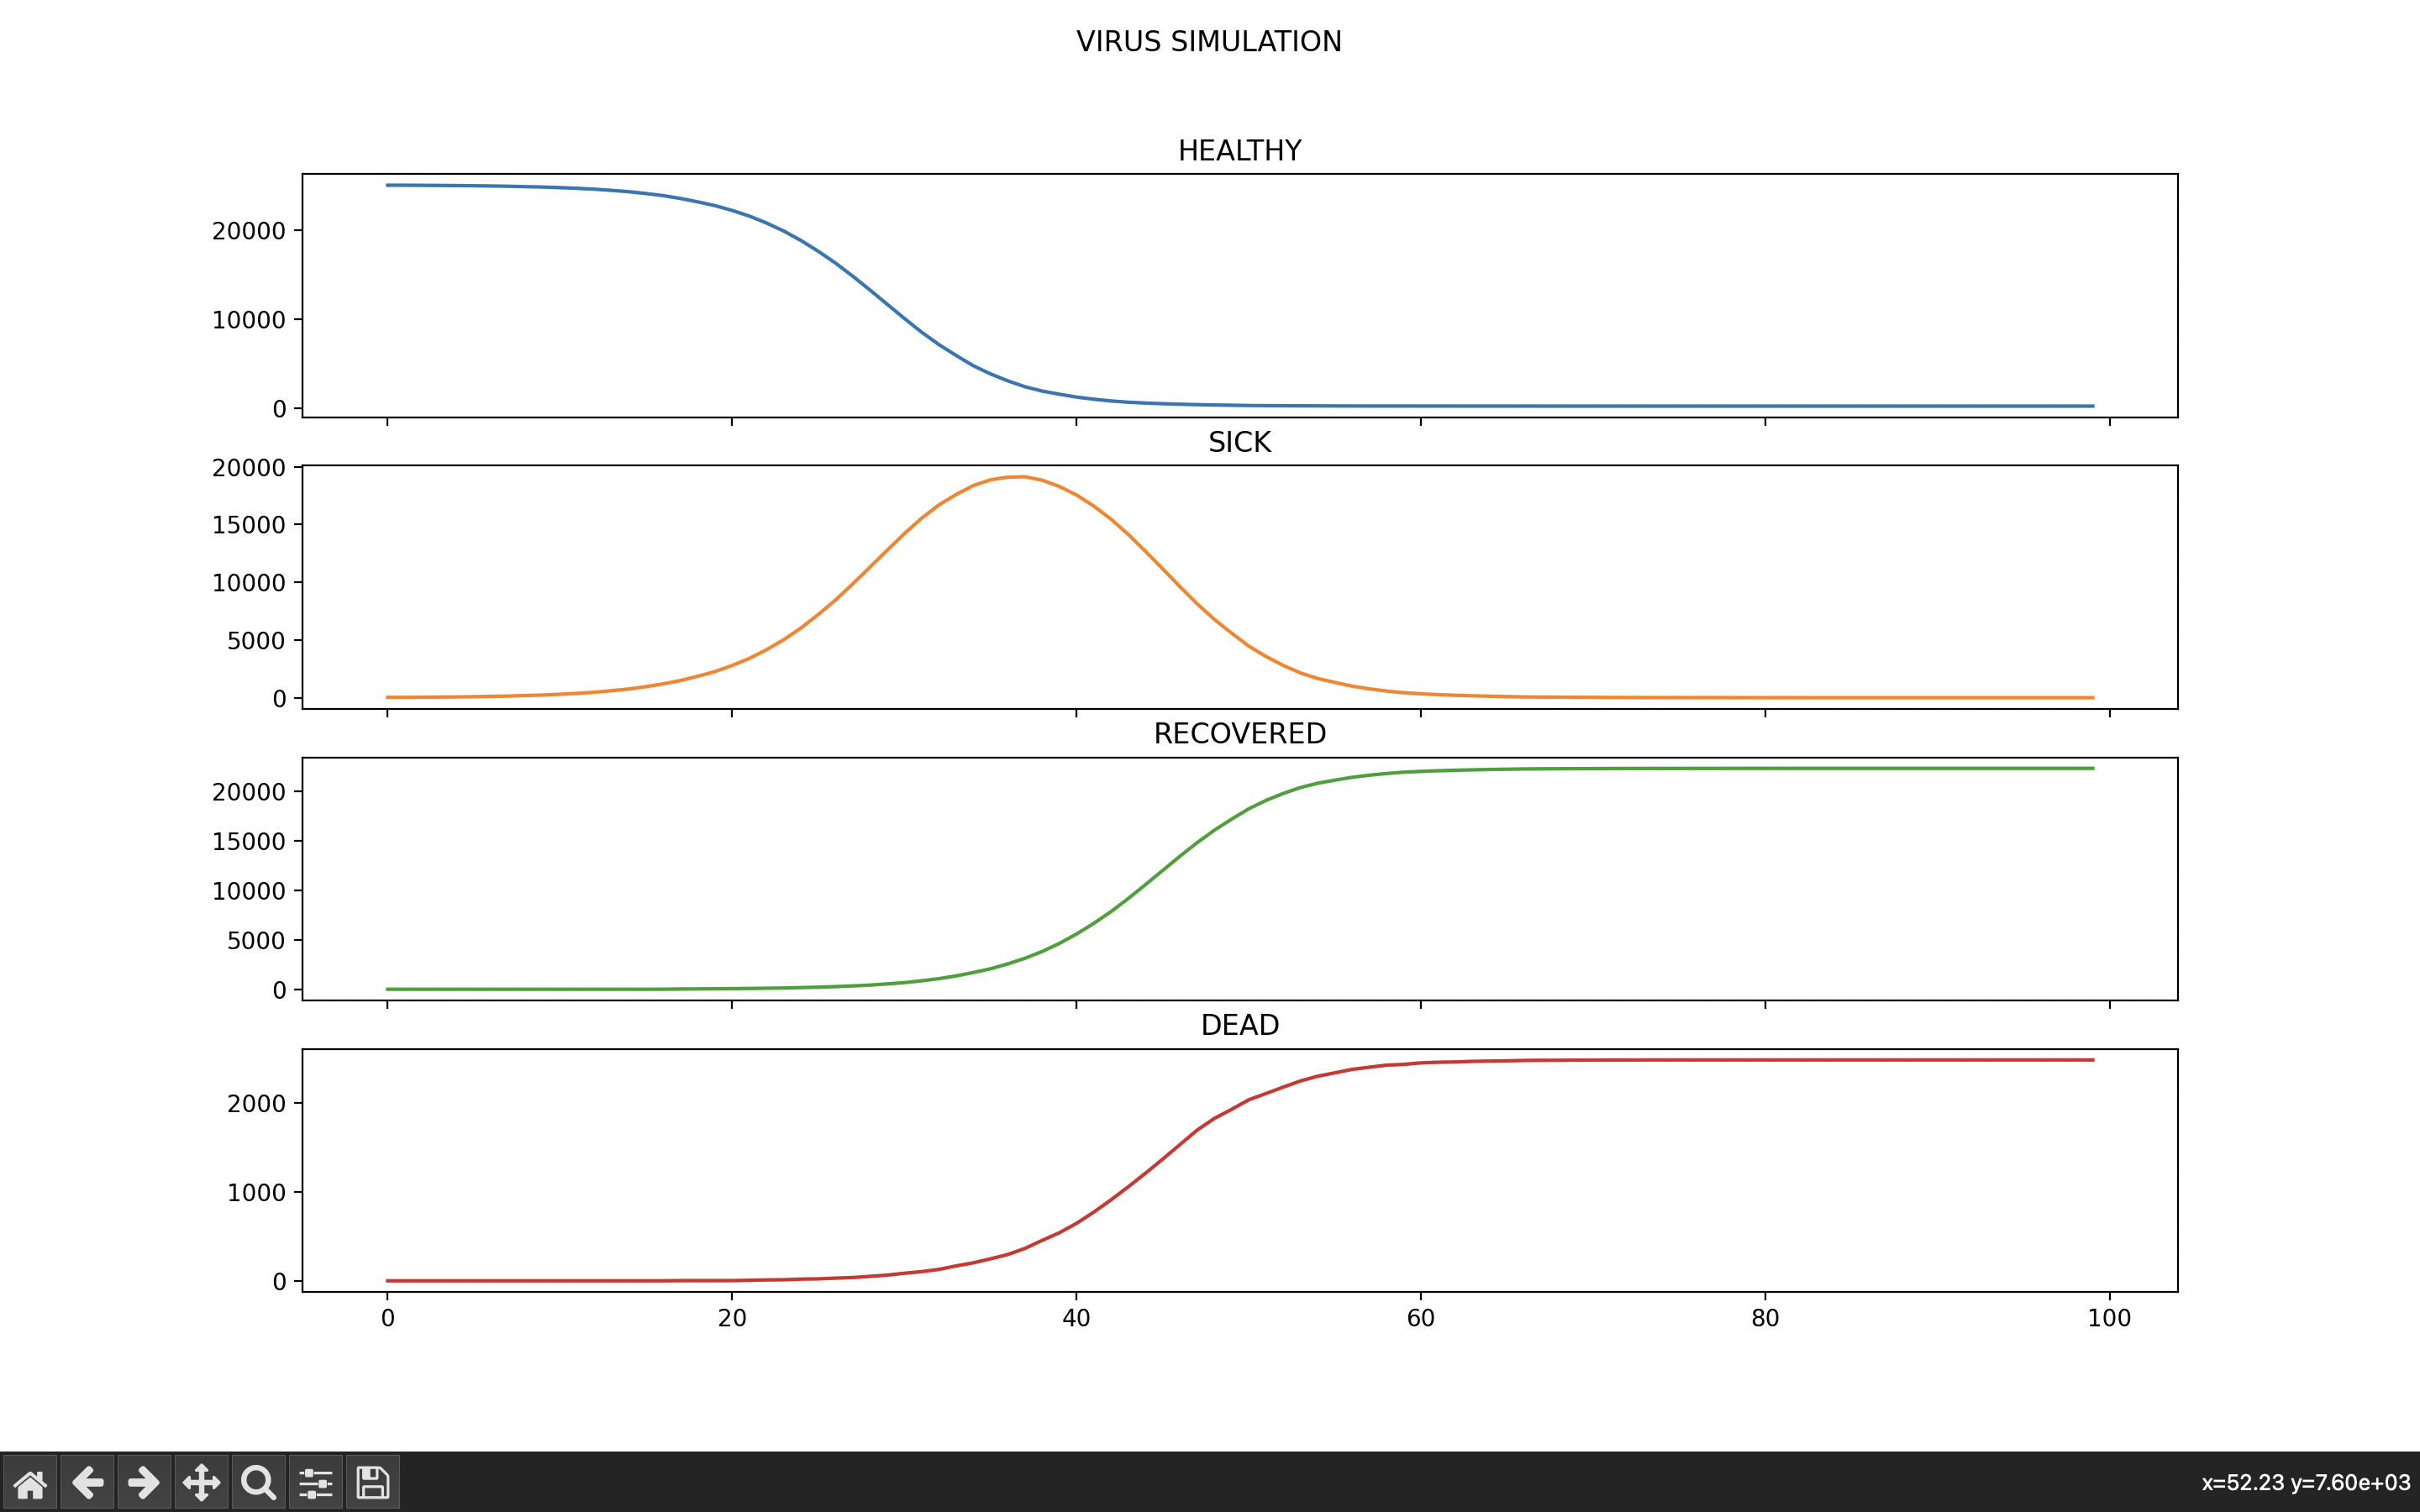
I have acquired proficiency in using the matplotlib package to create informative data visualizations, and have also leveraged the power of Pythons object-oriented programming paradigm to simulate the spread of a deadly virus among a population. Through the use of subplots, I have effectively displayed multiple visualizations in a single figure, enabling a more comprehensive analysis of the various aspects of my simulation. If I require any further assistance or have any specific inquiries, I will not hesitate to ask for help
- WebsiteGITHUB
- PlatformWindows/macOS/Linux/iOS/Android
- Stackpython
